A new chronicle of Caroline's Notebook will soon begin...
All ENTRIES BELOW WERE FOR FISH 541
Rapid senescence and differential gene expression in Sockeye salmon, Oncorhynchus nerka
Tentative Project Timeline
Week of 11.08.09
- Isolate RNA from samples
- Quantify RNA
- Treat samples for genomic contamination (DNase samples)
- Design and order primers for gene expression assays
- Check treated samples for genomic contamination
- Quantify DNased RNA to normalize for reverse transcription
- Synthesize cDNA
- Test primers in qPCR
- Run qPCR gene expression assay for genes of interest
- Begin data analysis
- Finish data analysis
- Write abstract
- Prepare presentation
December 5, 2009
Performed gene expression analysis.Expression analysis
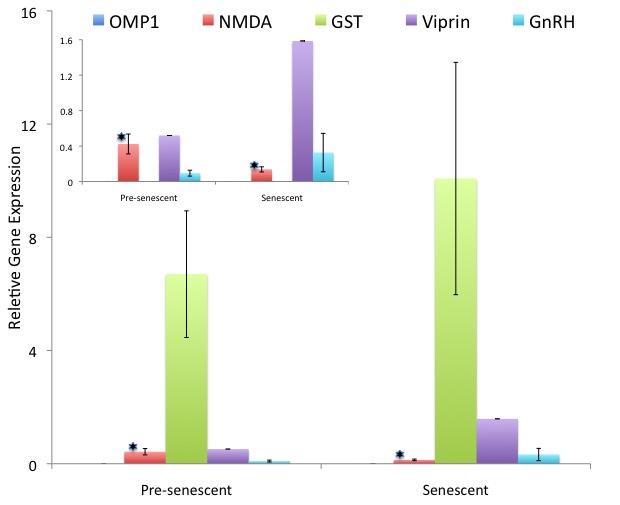
Average replicate Ct and and average gene efficancy for each gene were calculated in Miner . Relative gene expression was calculated as 1/((1+avg gene efficiency)^avg replicate Ct) for each gene of interest. The expression value was normalized to two housekeeping genes: beta actin and elongation factor. A type 3 t-test was used to test for significant differences in normalized gene expression for senescent and non-senescent samples. All statistical conclusions were the same for both house-keeping genes. The results for beta actin normalized genes are summarized in Figure 2.
Conclusions
Differential gene expression can between in senescent and pre-senescent sockeye salmon.
November 29, 2009
Ran qPCR gene expression assay for five genes of interest and two housekeeping genes.qPCR
Prior to reaction set-up, 4 ul of cDNA template was dehydrated on 384-well plate. Mater mixes were prepared for 5 ul reactions with the primers OMP1, NMDA, GST, Viprin, GnRH, EF1A, and bActin per the manufacture's instructions (SYBR Green 1). All samples were run in triplicate reactions on the Roche LightCycler using cycling and melt conditions described in the manufacture's protocol. Resulting raw fluorescence data to be used for gene expression analysis is available here: SockeyeSnesence_qPCR .
November 18, 2009
Synthesized cDNA from DNased RNA from 11.12.09. Tested primers for gene expression assays using qPCR.Reverse Transcription
For cDNA synthesis, a 25 ul reaction was prepared according to table 2 for each sample. To anneal the primer to template the reaction was incubated at 75C for 5 m and then immediately placed on ice for 10 m in order to prevent secondary structure from reforming. Following this, to each annealed primer template 10 ul M-MLV 5X buffer, 10 ul of 2.5mM dNTPs, 1ul of 200U/ul M-MLV RT, and 4 ul of water was added for a final reverse transcription volume of 50 ul. Samples were mixed, spun down, incubated at 37 C for 60 m, and heat inactivated at 95 C for 3 m. Resulting cDNA was stored at -20C for future use.
Primer Test
Each primer set, ten total, was tested on a pooled cDNA sample, a gDNA positive control, and a negative control templates in qPCR. Assay master mixes for 25 ul reactions were prepared as on 11.03.09. Amplification and sample melt were performed on the BioRad Opticon following the conditions described on 11.03.09. All ten primer sets worked with varying degrees of success (Table 3) and there was no cDNA amplification for the two vision related genes. This could indicate that these genes are not being actively expressed in the salmon brain tissue sampled. Primer test results are summarized in table 3.
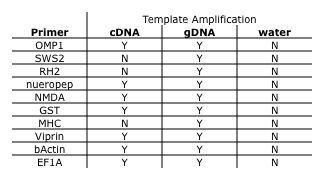
Table 3. Amplification result of each template for each primer set tested.
Conclusions and Next Steps
All primers tested today, and GnRH primers from before, will be used for gene expression assays. Assays will be performed next week using the AB 7900 real-time PCR instrument.
November 17, 2009
Quantified DNased RNA to normalize for reverse transcription reactions.RNA Quantification
All 16 DNased RNA isolates from 11.12.09 were quantified using the NanoDrop 1000 as described on 10.20.09. Nucleic acid concentrations are given in table 2.
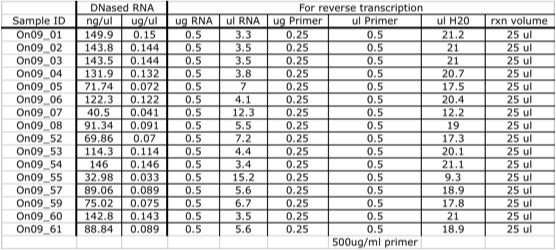
Table 2. Nucleic acid concentration of DNased RNA and reaction setup volumes and concentrations for the annealed primer/template for normalized reverse transcription reactions.
November 12, 2009
RNA from 11.11.09 was treated with DNase to remove gDNA carry-over. Pooled gDNA sample was made for a positive control in PCR. qPCR was run with purified RNA to check for gDNA contamination.DNase genomic DNA digestion
Before DNase treatment, 50 ul of each sample of concentrations < 200 ng/ul was aliquoted into a 0.5 mL micro-centrifuge tube. Samples of concentrations > 200 ng/ul were diluted to 10ug/50ul in 0.5 mL micro-centrifuge tubes. Carry-over genomic DNA was digested in all 50 ul aliquots using a rigorous DNase treatment according to the manufactures instructions (Ambion TurboDNA-free Kit ).
qPCR check for gDNA carry-over
A real-time PCR was run to ensure that gDNA carry over had been removed. Each sample and a positive control of pooled sockeye salmon gDNA was diluted 1:4 to mimic template concentrations in qPCR gene expression assays. A master mix was pre-pared for 18 50 ul reactions (16 RNA samples, the gDNA positive control, and a negative control) following the reaction concentrations and using the GnRH primers described on 11.03.09. Reactions were carried out on the BioRad Opticon Real time PCR detection system using the conditions described on 11.03.09 (Figure 1). Amplification was only present in the gDNA positive control (yellow line).
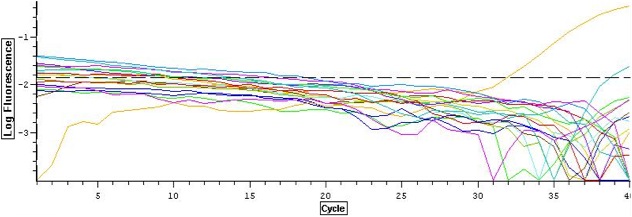
Figure 1. qPCR log amplification plot for each reaction. Amplification is only seen in the gDNA positive control.
Conclusions and Next Steps
Detectable gDNA carry-over has been removed in DNased samples. The samples will now be reverse transcribed.
November 11, 2009
RNA isolations were completed and all samples were quantified. Primers were designed and ordered.RNA Isolation and Quantification
RNA was isolated from the remaining twelve samples as on 11.10.09. There were no deviations from this protocol. Pellets were visible in all reactions. All 16 isolates were quantified using the NanoDrop 1000 as described on 10.20.09. Measured nucleic acid concentrations are given in Table 1.
Primers Design
Primers were designed for genes of interest from Oncorhynchus nerka mRNA sequences available on NCBI using Primer3 version 0.4.0 (Primer3 )
Gene and primer details are provided here: SockeyeSenescencePrimers .
Conclusions and Next Steps
RNA was successfully isolated from all samples. There is a wide range in isolate concentration, but a high enough yield for subsequent reactions. All samples will be treated for genomic carry-over.
November 10, 2009
Samples were selected for the project and RNA isolations were begun.Samples
Sockeye salmon brain tissue samples were collected during sumer 2009 from Hansen Creek in Southwestern Alaska. Each sample contained between 1-1.5 g of sonicated brain tissue and were stored in 5 mL of Tri-reagent (half the amount needed for RNA isolations) at -80C.- Six pre-senescent and six senescent male sockeye salmon were chosen for this project.
- 500 ul of each well mixed sample was aliquoted into a fresh 1.5 mL RNA-free microcentrifuge tube containing 500 ul of Tri-reagent for RNA isolations.
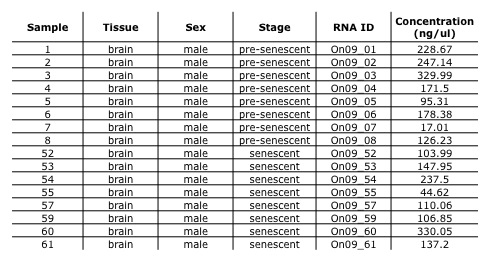
Table 1. Sample information and RNA isolate concentration.
RNA Isolation
RNA was isolated from tissue samples 1-4 using the Tri-reagent protocol described in detail on 10.13.09. There were no deviations from this protocol. Pellets were visible in all reactions. All samples were eluted in 100 ul of 0.1% DPEC water.
Conclusions and Next Steps
- Only males were chosen in order to reduce latent sample variation. Pre-senescent and senescent samples were chosen in order to increase the probability of detecting a difference in gene expression levels.
- RNA will be isolated from the remaining samples on 11.11.09. The success of each isolation will be checked by quantifying nucleic acid concentration on the NanoDrop 1000.
November 3, 2009
GnRH qPCR
Gene expression of the gonadotropin-releasing hormone precursor (GnRH) in sockeye salmon brain was tested for using qPCR.Methods and Results
qPCR
A total of 6 50 ul PCR reactions were prepared in thin walled PCR tubes to contain 25 ul of 2X Immomix Master Mix, 3 ul of 50 uM Syto-13 dye, 2.5 ul of both the 10 uM forward and reverse primers from 10.20.09, 15 ul of nuclease free water, and 2 ul of template. Two reactions contained cDNA from 10.20.09 as template , two reactions contained total RNA isolate from 10.13.09 as template to check for genomic contamination, and two contained nuclease free water as template for negative controls. Sample amplification was performed at the following themerocycling parameters: 95C for 10 m and 40 cycles of denaturation at 95C for 15 s, annealing at 55C for 15 s, and extension at 72 C for 30 s. Amplification was immediately followed by sample melting using the following thermocycling profile: 95C for 1 m, 55 C for 1 s, a 0.2C temperature increase every second with a 30 S incubation at every 0.5C increase until 95C, and 10 m at 21C.
Reactions containing cDNA amplified with a cycle threshold value of ~33 cycles, and there was no amplification in the reactions containing RNA and the negative controls (Figure 1). Gene amplification in the cDNA samples was corroborated with the presences of two single peaks at 81.5C when the amplicon melted and no peaks for the RNA and negative control reactions (Figure 2).
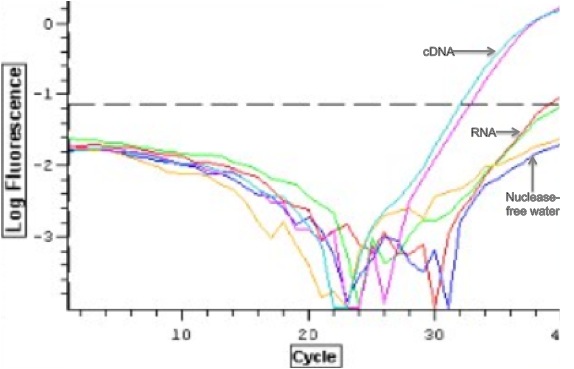
Figure 1. qPCR log amplification plot for each reaction with template indicated next to each replicate pair.
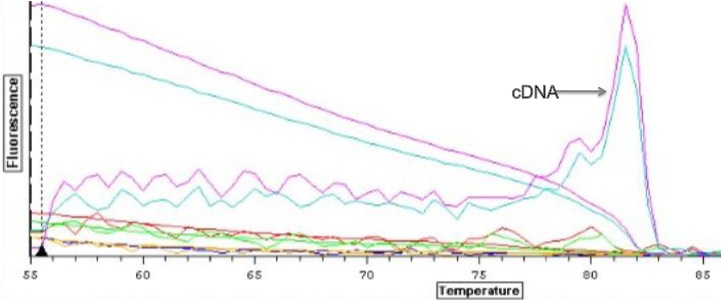
Figure 2. Derivative melt curves for each reaction.
Conclusions and Next Steps
Successful amplification of cDNA with minimal genomic contamination indicates that GnRH is being expressed in sockeye brain tissue. These primers will be used again to examine differential gene expression in senescent and non-senescent sockeye salmon.
October 27, 2009
Western Blotting and agarose gel electrophoresis
Total protein isolate from 10.20.09 was separated using electrophoresis and transfered to a membrane for Western Blotting of Hsp70. PCR products from 10.20.09 were run on an agarose gel to check product size and genomic contamination.Methods and Results
Agarose Gel Electrophoresis
The 1.5% agarose gel made on 10.20.09 was used to run the pcr products from 10.20.09. The gel was covered with 1X TAE buffer and 7 ul of 100 bp ladder and 25 ul of each PCR product were loaded into the appropriate well indicated in Figure 1. The gel was run for 1 h at 100 V and then visualized on a UV transiluminator.
Faint banding was visible in both PCR products containing the cDNA sample at ~200 bp. Both the samples and the blank had faint banding at <200 bp.

Figure 1. Gel electrophoresis photo of PCR products from 10.20.09. Lane contents are indicated at the top and band sizes denoted with arrows.
Protein Electrophoresis and Western Blotting
A 10 ug aliquot of total protein isolate from O. nerka brain tissue was run on a 4-20% acrylamide Tris-HEPES-SDS gel following the protocol described on 10.13.09. However, before staining of the gel, the separated proteins were transfered to a nitrocellulose membrane for Western Blotting. For protein transfer, the transfer buffer was first cooled to 4C and then filter paper, nitrocellulose membrane, and the gel were soaked in the transfer buffer for 15 m. The blotting stack was then assembled on top of the anode face of the electrophoresis rig in the following order: filter paper, nitrocellulose membrane, protein gel, filter paper. Then the cathode face of the rig was placed on the transfer stack after all bubbles had been removed. The protiens were then transfered on the membrane for 30 m at 20 V. After transfer, the gel was removed from the stack, rinsed with transfer buffer and stained (Figure 2a) as described on 10.13.09. Bands of different sizes were visible on visualized SDS gel.
The Invitrogen Western Breeze blotting protocol was used to immuno-blot the membrane (Western Breeze ). First, 20 mL of blocking solution was prepared with 14 mL of ultra filtered water, 4 mL of Blocker A and 2 mL of Blocker B. The membrane was then transfered to the provided plastic dish and incubated for 30 m on the rotary shaker in 10 mL of the blocking solution. After 30 m, the solution was decanted and and the membrane was rinsed with 20 mL of water for 5 m twice. A 1:3000 10 mL primary antibody solution was prepared with the remaining 10 mL of blocking solution and 3.3 ul of Hsp70 antibody.The membrane was then incubated in the primary antibody solution overnight. The next day, the membrane was washed in 20 mL of the provided antibody wash for 5 m four times before being incubated in the secondary antibody solution for 30 m. A second series of four 3 m washes in 20 mL of antibody wash performed and then the membrane was incubated in 5 mL of the Chromogenic substrate to develop and visualize the bands (Figure 2b). There was very minimal color development in sample lane.
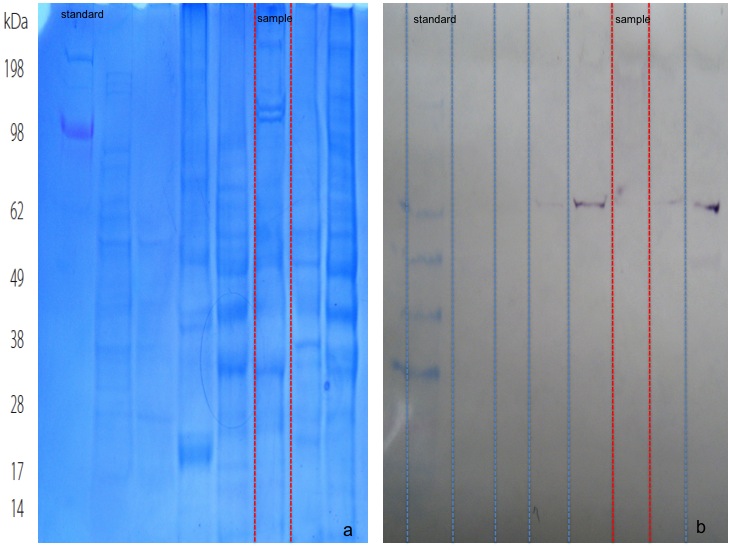
Figure 2. SDS-PAGE protein electrophoresis gel with protein standard (a) and sample. Western immunoblot of the same gel (b).
Conclusions and Next Steps
Although banding is weak in the PCR agarose gel, there does appear to be amplification in each sample reaction near the expected size of amplicon of 230 bp. These primers then should be successfully used in qPCR to measure gene expression next week. The faint banding present bellow 200 bp in both the samples at negative control is probably primer dimer. PCR optimization might minimize this. The lack of any other bands suggests that there might not be genomic contamination however further testing is needed to confirm this.
The immno blot of the total protein was only marginally successful with very faint color development. Hsp70 may not be expressed in this sample. Interestingly a similar salmon brain sample from AS run in the lane to the left of the sample very clearly indicates Hsp70 protein expression. Either there is differential protein expression or recalling the protein isolation on 10.03.09 the incomplete homogenization of the sample tissue has affected the ability to visualize Hsp70 protein expression.
October 20, 2009
O. nerka total RNA quantification, reverse transcription, and GnRH gene amplification
Total protein isolate from O. nerka brain tissue was quantified and reverse transcribed for end-point PCR amplification of the gonadotropin-releasing hormone (GnRH). An agarose gel was prepared to check for PCR product quality and contamination in the following week.Methods and Results
Total RNA Quantification
The RNA isolated from sockeye salmon brain on 10.13.09 was quantified and checked for contaminants using the NanoDrop 1000 Spectrophotometer using the manufacture's instructions (NanoDrop ). First, 2 µl of 0.1% DEPC water was used to zero the instrument and then 2 µl of sample was loaded on to the pedestal and the absorbance measured. From the absorbance the instrument calculated the RNA concentration using Beer-Lambert Law. At an A260 RNA absorbance was 1.183 with a calculated concentration of 47.3 ng/ul. The A260/A280 and the A260/A230 ratios were 1.63 and 0.34 respectively.Primer Reconstitution
Forward and reverse primers designed on 10.06.09 were reconstituted with nuclease free water to make a 100µM stock. A 10µM aliqout of primer was mixed for a working stock.
cDNA Synthesis
In a 0.5 mL thin-walled PCR tube, 5 µl of 47 ng/µl RNA isolate was incubated at 75ºC for 5 m in a thermal cycler and then immediately transfered to ice for a second 5 m incubation. Following incubation, a 20 µl reverse transcription reaction was prepared with the 1 ul (0.235 µg) of incuabted RNA, 8 µl of 10mM dNTPs, 1 µl of Oligo dT Primer from Promega, 4 µl of Promega 5X AMV RT Buffer, 1 µl of AMV RTranscriptase (Promega AMV RT ), and finally 1 µl of RNase free water. After mixing and pooling the sample via centrifugation, it was incubated at RT for 10 m, followed by a 1 h incubation at 37°C, and then heat inactivation at 95C for 3 m. The newly synthesized cDNA was then stored at -20°C.
End-point PCR
The the precursor gene for the GnRH was amplified in polymerase chain reaction using the newly synthesized cDNA as template. Two 50 ul sample reactions and two negative controls were prepared each containing 25 ul of 2X GoTaq®Green Master Mix, 2.5 ul of each 10 uM forward and reverse primers, 18 ul of nuclease free water and either 2 ul of cDNA template or water. The four reactions were then denatured initially at 95C for 10 m to activate the polymerase and then cylcled 40 times through a series of denaturation at 95C for 30 s, annealing at 55C for 30 s, and extension at 72 C for 90 s. This was then followed by a final extension of 72 for 3 m after which the samples were then stored at 4C.
Agarose Gel Preparation
A 1.5% agarose gel was prepared my heating 2 g of agarose mixed with 150 mL of 1X TAE in a 1 L Erlenmeyer flask in the microwave until the agarose had gone completely into solution and the mixture became clear. Once the flask was cool to the touch 12 µl of ethidium bromide was added to the solution and mixed by swirling before being poured into the a gel tray. Immediately after pouring, combs were inserted and the gel was then allowed to set before storage at 4ºC. The stored gel will be used to check the quality and size of the amplified PCR product as well as check for product contamination.
Conclusions and Discussion
The A260/A280 and the A260/A230 absorbance ratios of the RNA isolate deviate from the expected, possibly indicating contaminants such as genomic DNA. The presence of genomic DNA contamination and the specificity of the designed primers will be screened for next week by running the amplified cDNA from this week on the agarose gel next week. Assuming successful amplification of the gene of interest, it might be expected that genomic contamination would appear as a a second band larger than the intended amplicon as the genomic DNA may contain introns. With successful amplification of the gene of interest the RNA isolate will be used for a quantitive measure of gene expression using qPCR.October 13, 2009
Sockeye Salmon Brain Tissue Prep and Protein Electrophoresis
O. nerka total protein isolate was run on a SDS-PAGE gel to examine protein molecular weight diversity in the salmon brain tissue sample. Total RNA isolation from previously homogenized tissue stored in Tri-Reagnet at -80°C was completed for quantification and cDNA synthesis.SDS-PAGE Protein Electrophoresis
A 9.5 µg aliquot of isolated Sockeye salmon brain protein from 10.06.09 was prepared for SDS-PAGE electrophoresis by mixing 15µl of sample with 15µl 2X Reducing Sample Buffer and boiling the mixture for 5 m after brief centrifugation. After boiling, the prepare sampled was centrifuged for 1 m to pool liquid. The gel cassette and gel tank were then set up according to Thermo Scientific Precise™ Protein Gel specifications (Precise Protein Gel ) and the prepared protein sample was loaded into the appropriate well of a 4-20% acrylamide Tris-HEPES-SDS gel. The sample was then run at 150 V for 30 m with SeeBlue® Plus2 Protein Standard from Invitrogen after which the gel was stained with enough Coomassie Brilliant Blue non-selective protein stain to cover the gel for 5 m on a rotating platform. After staining, the gel was then rinsed once with 10% acetic acid and subsequently washed three additional times at 15 m intervals with the acetic acid following which the stained protein in each sample soon became visible (Figure 1).
Proteins of several different molecular weights were visible with a distinct double band around 98 kDa. This double band may represent protein isoforms. The migration distance of some of the bands in the sample is similar to protein standard and may indicate proteins of similar molecular weights. A band around 70 kDa could be the heat shock protein HSP70, the presence and identity of which will be tested for using Western Blotting in coming weeks.
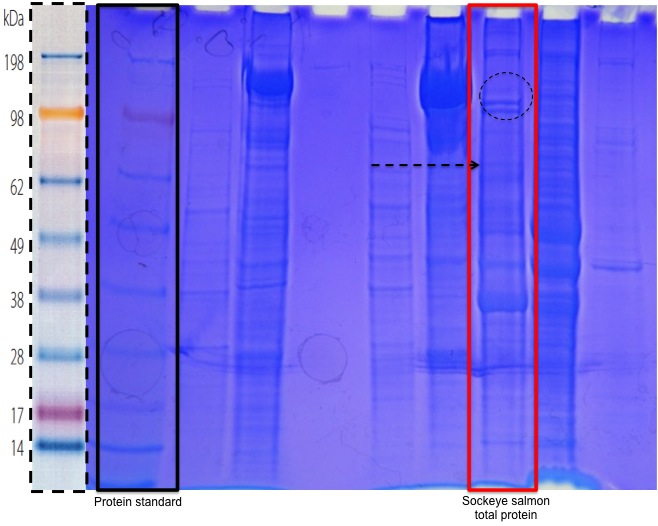
Figure 1. SDS-PAGE protein electrophoresis gel with protein standard and molecular weights outlined in solid black and sockeye salmon sample outlined in red. Possible protein isoforms are indicated with dashed circle and protein band with similar molecular weight to HSP70.
Total RNA Isolation (continued from 10.06.09)
The homogenized sample previously stored in Tri-Reagent at -80°C was incubated at RT for 5 m before 200µl of chloroform was added. Following 30 s of vortexing, the sample became a uniform milky white as anticipated. After a second 5 m incubation at RT the sample was spun at max speed at 4°C for 5 m. The less dense clear aqueous phase was carefully pipetted off and transfered to a clean 1.5 mL micro-centrifuge tube while the remaining organic phase was properly disposed of. To the clean tube containing the aqueous phase with RNA 500µl of isoproponal was added and mixed via pipetting producing a clear uniform solution. The sample was then incubated at RT for 10 m and spun at max speed at 4°C for 8 m with hinge of the tube facing up. After centrifugation a faint pellet had developed in the bottom of the tube. Being careful not to disturb the pellet, the supernatant was drawn off and the pellet was resuspended in 1 mL of 75% EtOH and then spun at 7500g at 4°C for 5 m. Following centrifugation the EtOH was carefully drawn off and any residual EtOH was allowed to evaporate on the bench top for 5 m. The barely visible pellet was then resuspended in 100µl of 0.1% DEPC water, mixed, and then incubated at 55°C for 5 m to facilitate resuspension. The sample, now containing isolated total RNA, was then stored at -80°C for future quantification and use in qPCR gene expression assays.
October 6, 2009
Sockeye Salmon Brain Tissue Prep
Sockeye salmon, Oncorhynchus nerka, brain tissue was prepared using Tri-Reagent total RNA isolation and CellLytic MT protein extraction protocols for future use in gonadotropin-releasing hormone precursor (GnRH) qPCR gene expression assays and Western Blot analysis of heat shock proteins (HSP) respectively. Total protein concentration was measured using the Bradford Protein Assay.Total RNA Isolation
In a sterile workspace, 50-100 mg of brain tissue was homogenized in 500µl of Tri-Reagent in a 1.5 mL micro-centrifuge tube using a disposable pestle and vortex. Total homgenization did not occur after 15 m of treatment and was presumed lysed sufficiently for necessary RNA yield. An additional 500µl of Tri-Reagent was added to the partially homogenized tissue before storage at -80°C for protocol completion the following week.
Total Protein Extraction and Quantification
In a 1.5 mL micro-centrifuge tube, 25 mg of salmon brain was homogenized in 500µl of CellLytic MT solution as described previously for total RNA isolation. Similarly to the total RNA isolation, tissue did not homogenize completely. After homogenization the sample was spun at 4°C for 10 m at max speed in a micro-centrifuge and the resulting supernatant containing the extracted total protein from the tissue was transfered to a sterile tube for storage at -20°C.
To quantify the amount of total protein extracted from the sample using the Bradford protein assay, 15µl of protein was diluted with 15µl of DI water and mixed in a new tube to ensure that the sample absorbance was well within the standard curve range. A blank was then prepared of 30µl of DI water. To the blank and the sample, 1500µl of Bradford reagent was added and mixed well before incubating at RT for 10 m. After incubation, the development of color in the sample and the reagent blank was noted and as expected. Before being transfered to disposable cuvettes for absorbance measurements, both the sample and the blank were mixed again. To measure the sample absorbance the spectrophotometer was zeroed using the reagent blank. Then the sample absorbance was measured. After brief mixing with a micro-pipet the sample absorbance was measured a second time and the two values were averaged.
From the average sample absorbance, the equation y = 1011.9x (R² = 0.9759), from a standard curve generated by Mac Gavery per the manufactures instructions, was used to calculate the the concentration of diluted protein, x, in µg/mL using the absorbance measured, y. To account for the sample dilution the calculated concentration was multiplied by two for a total yield of 683.0 µg/mL of protein in the piece of salmon brain tissue.
Primer Design
In preparation for measuring the gene expression of GnRH in the sample of salmon brain using qPCR in the coming weeks, primers were designed from the complete cds of Oncorhynchus nerka GnRH precursor, NCBI accession number D31868, using Primer3 version 0.4.0 (Primer3 ) to amplify a 226 bp region of the gene.
Forward 5'-ATTGGTCGTATGGGTGGCTA-3' Tm:60.2ºC
Reverse 5'-TCTTGAATGCTCCATCATCG-3' Tm:59.7ºC
